Terrain · UCLA
Built from students, for students
Free datasets, faculty contacts, and guided projects in R and Python. The path we wished we had.
Live demo · UCLA campus emissions tracker
Verified campus emissions (Scopes 1–3) vs. UC’s current climate commitment (90% below 2019 by 2045).
No prerequisites and no paid software. A clear path from your first dataset to a finished project you can show in class or on a resume.
Choose from free environmental datasets on air quality, climate, and pollution burden. Each one includes notes on how to use it, so you can skip the hardest part of getting started.
Open a starter notebook in Colab or RStudio and work through it step by step. Several projects and skills lessons include mentor walkthrough videos.
Apply what you learned in a faculty lab, a community project, or a UCLA research program. Browse programs
Selected datasets from our library. All are public, free, and useful for environmental work, with short explainers and starter notebooks.

California's map of pollution burden and community vulnerability, down to the census tract. The backbone of most EJ analysis.
Open explainer →
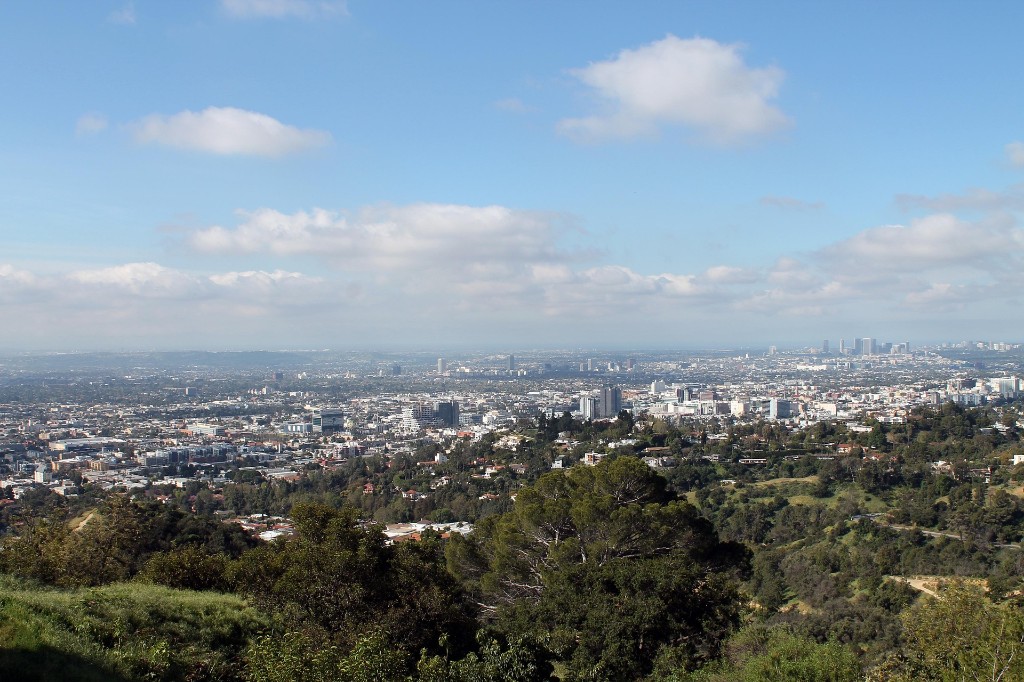
Live and historical air quality readings across the U.S. Great for your first time-series or mapping project.
Open explainer →
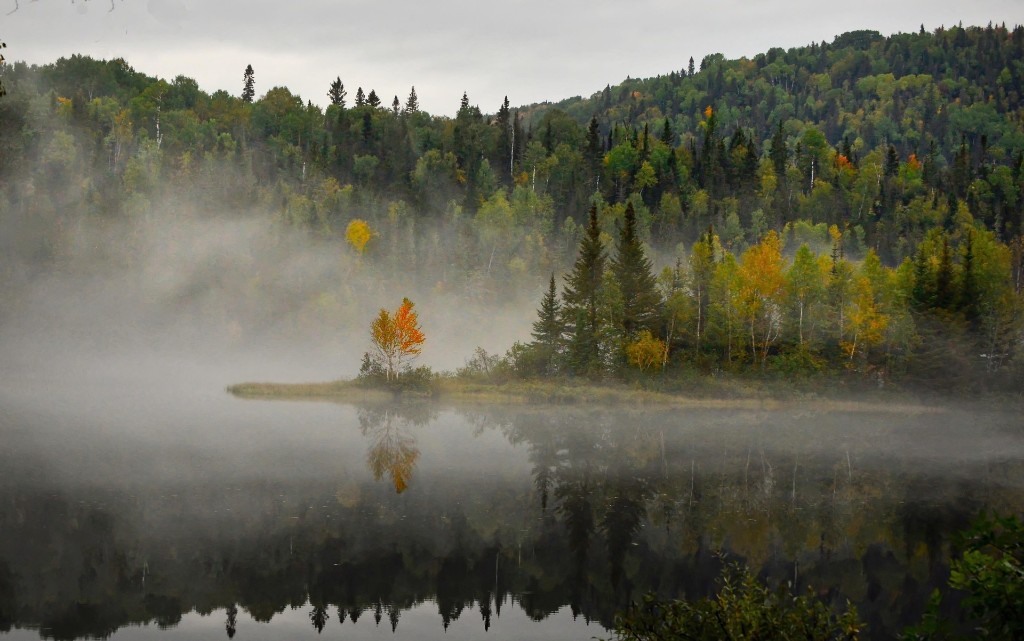
Temperature, precipitation, and extreme weather records going back decades. A reliable starting point for climate analysis.
Open explainer →
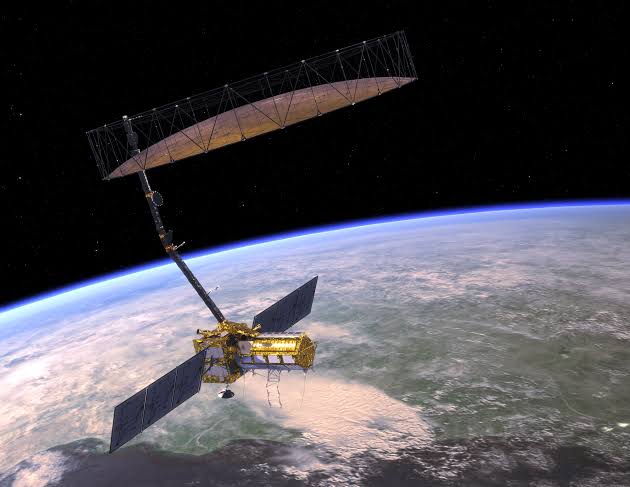
Earth observation data from orbit: ice, vegetation, and surface temperature. More advanced formats, but a standard source for satellite work.
Open explainer →
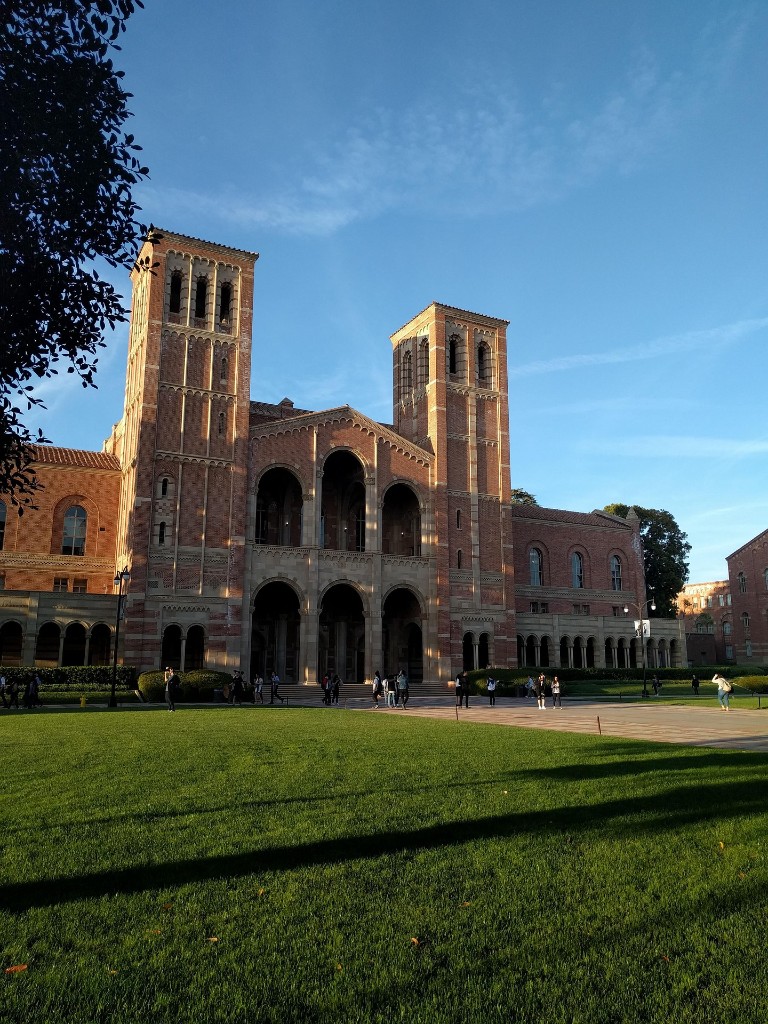
Third-party verified campus GHG inventories (Scopes 1–3) from UC Annual Sustainability Reports. Source for Terrain's carbon tracker.
Open explainer →
Streamflow, groundwater, and quality measurements nationwide. Perfect for a drought or watershed project.
Open explainer →One recommended starter at each level. Each has a runnable notebook; several include mentor walkthrough videos.
Use EPA AirNow data to build your first air quality map. The notebook walks you through each step—no prior coding experience required.
Use USGS streamflow data to follow how a river system responds before, during, and after a dry spell. Introduces joining multiple sites and seasonality.
Download Climate TRACE facility-level greenhouse gas inventory for California, rank the biggest sources by sector, and map where emissions concentrate.
Statistics & Data Science faculty plus IoES-affiliated researchers in AOS, Geography, Environmental Health Sciences, and related departments. Search by name or topic, then draft or copy an email from any card.
Keep it short (about 150 words). Mention something specific about their work, say what you have done so far, and ask for a 15-minute meeting.
Use your UCLA email and proofread before you send. New to research? See Undergraduate Research (URC).
No matches. Try a broader search term.
Selected programs from our full guide: degrees, capstones, fellowships, and research opportunities, with links to official UCLA pages.
A full year solving a real environmental problem for a real client. NRDC, LA County, NPS, and more. The main applied experience for Environmental Science majors.
Official overview ↗Paid placements with environmental justice organizations through the Luskin Center for Innovation. Fellows do action research with mentorship from community partners.
How to apply ↗10-week satellite data projects for real partners (wildfire, water, air quality). Many UCLA students participate through the JPL node in Pasadena.
NASA program page ↗Terrain is free and open to everyone. Join the mailing list for new datasets, projects, and program updates.